
S.C. growth clustered along coast and Charlotte areas
COLUMBIA - South Carolinians are gravitating toward the state's coastline and the suburbs south of Charlotte, detailed Census figures released Thursday show.
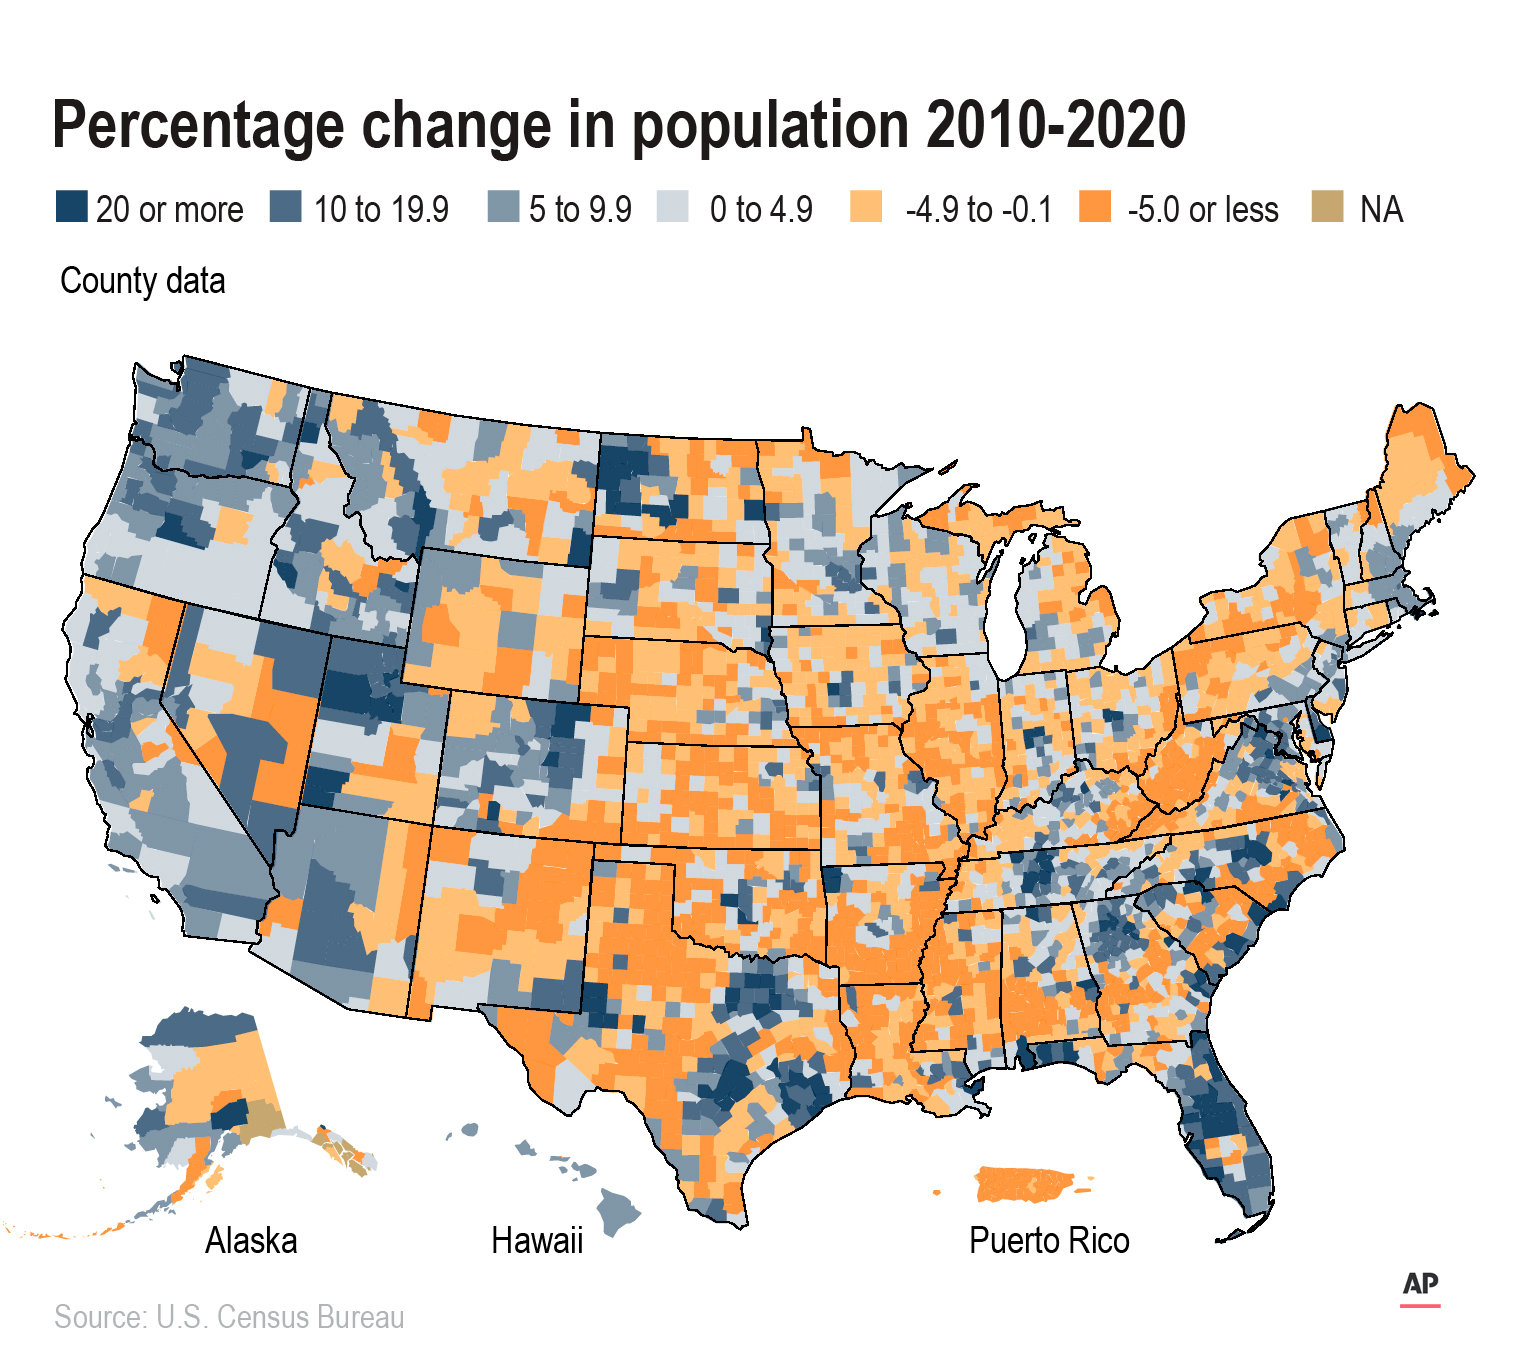
Since 2010, the state has grown by nearly 500,000 people to a total population of 5.1 million in 2020, though it wasn't enough to add another U.S. House seat. Still, the 10.7% increase makes South Carolina the 10th-fastest-growing state as it rises above Alabama to become the 23rd-most-populous state in the U.S.
The most concentrated growth took place in Horry County, home of tourist-friendly Myrtle Beach, where the population shot up 30.4% to more than 350,000 residents. Farther south on the coast, Berkeley County followed with a 29.2% increase in people.
Another population boom occurred in York and Lancaster counties, just south of Charlotte. York County added 56,017 people, and Lancaster drew 19,364 new residents.
Greenville County remains the state's most populous, with more than half a million people, followed by Richland, home to the capital city of Columbia, and coastal Charleston.
Meanwhile, the state's smallest county, Allendale, was also the one that lost the biggest share of people. Located near the southern end of the South Carolina-Georgia border, Allendale saw its population decline 22.8%, down to 8,039 people in 2020.
Allendale is one of 24 mostly rural counties that saw population declines during the past decade. Others include Bamberg, with a 16.7% decline, and Lee, which lost 14% of residents.
Some demographic shifts are taking place as well. Overall, South Carolinians are a little older, with 21.6% of residents under the age of 18 in 2020 compared to 23.4% in 2010.
The two largest racial and ethnic groups in the state, whites and African-Americans, both saw their share of the population drop slightly in the past decade. Though whites made up 64.1% of South Carolinians in 2010, they comprised 62.1% as of last year. And 24.8% of South Carolinians were Black in 2020 compared to 27.7% 10 years earlier.
People who are Hispanic or Latino make up the state's third-largest group, growing from 5.1% to 6.9% of the population during that time.
State lawmakers have been awaiting Thursday's full data release before they begin to draw lines for U.S. House, state Senate, state House and local districts, though redistricting hearings are already underway. A Senate committee is wrapping up its meetings, while House lawmakers are gearing up to start their own round of hearings across the state, starting in Myrtle Beach next month.
Legislators taking public testimony as they contemplate how to redraw boundaries have already heard from some rural residents worried that the new districts will diminish their already limited power.
Though historically in South Carolina, rural areas often commanded state politics, the population shift makes the loss of power inevitable, said College of Charleston political scientist Gibbs Knotts.
"It was a long time dominated by the rural areas. That's just not the case anymore," Knotts said.
The release of the redistricting data culled from the 2020 census is occurring more than four months later than expected because of delays caused by the pandemic. The redistricting numbers - which are used by states to redraw congressional and legislative districts - show where white, Asian, Black and Hispanic communities grew over the past decade.
The figures also show which areas have gotten older or younger as well as the number of people living in dorms, prisons and nursing homes. The data covers geographies as small as neighborhoods and as large as states. An earlier set of data released in April provided state population counts and showed the U.S. had 331 million residents last year, a 7.4% increase from 2010.